The Impact of Interstate 40 on Wilmington, North Carolina: Final Project

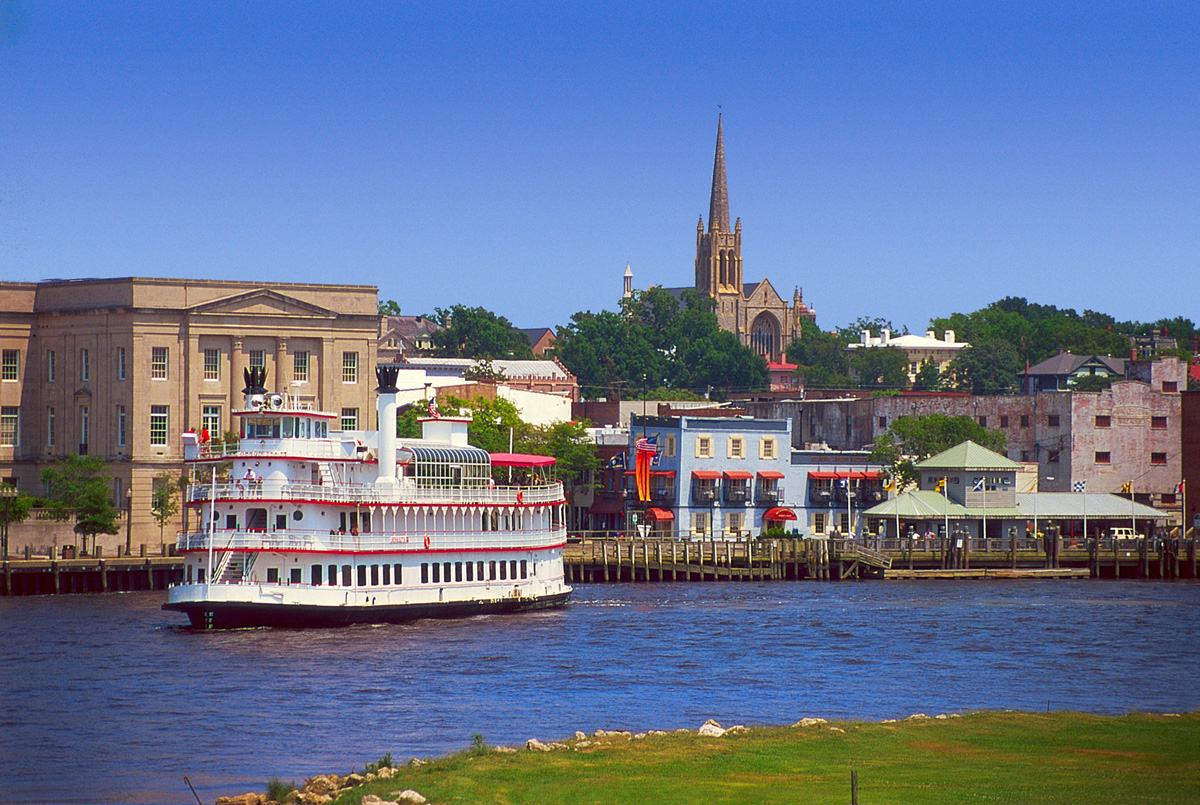
The historic Riverwalk in Wilmington, North Carolina. Tourism is an enormous industry for the city.

History of Wilmington, North Carolina

Along the southeastern coast of North Carolina is a coastal town called Wilmington. It was established in between the Cape Fear River and the Atlantic coast in 1739. The city was first known for its lumber industry and was conveniently located along the coast and was an instrumental port in the region. During the Civil War the port was heavily relied upon as an entry point for supplies and trading with Europe for supplies. Eventually, the port fell to the Union forces. Wilmington once again rose to prominence during the two World Wars as a home to the North Carolina Shipbuilding Industry. After the wars the biggest boost has come from the completion of Interstate 40 from Raleigh to the Wilmington.

Interstate 40s Importance

It is well known the importance of roads throughout history. They have proven time and time again that in order to spread culture, people and products to be essential to expansion. While Wilmington was already an established port city in the region it lacked the ability to efficiently transport goods to surrounding areas away from the coast. Without a road that was able to facilitate quick and efficient transportation routes inland Wilmington was unable to capitalize on the expanding economy of the region. The completion of Interstate 40 allowed Wilmington to participate in the economy of the region more easily and also allowed for an explosion in industries such as tourism. Along with a boost in the economy came a population increase that undoubtedly arose from the number of jobs that became available one the construction of Interstate 40 was completed.

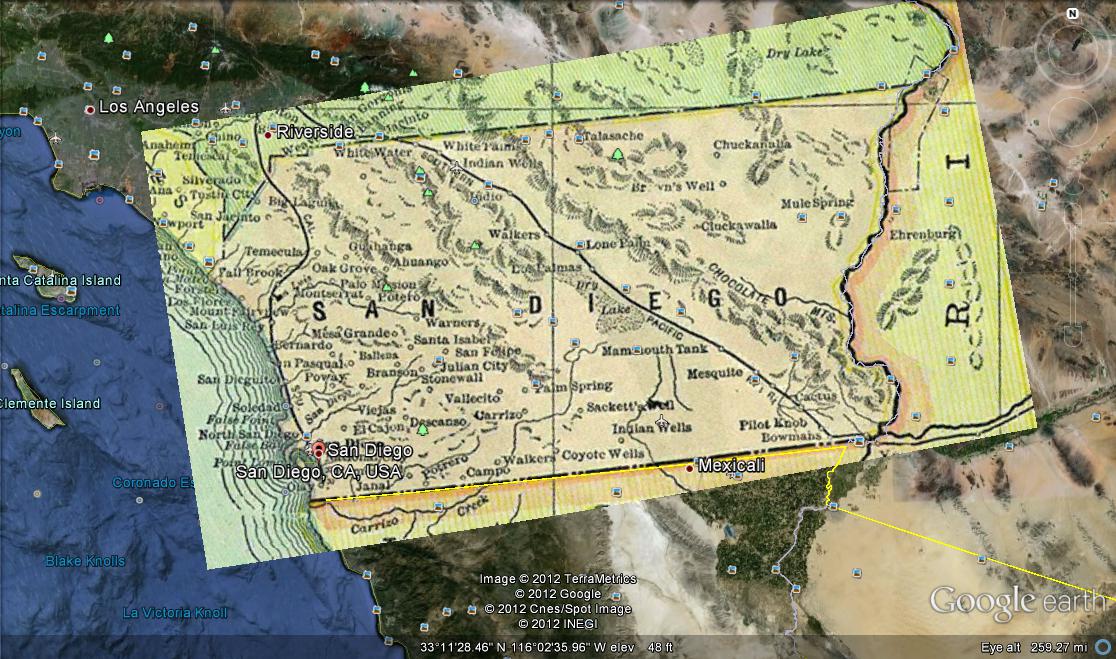
The above map is from the Department of transportation and shows that there is no immediate route in between Wilmington and Raleigh.

Before Interstate 40

Interstate 40 is the third longest road in America and stretches from Barstow, California to Wilmington, North Carolina. The Interstate originally ended on the eastern side of the country just outside of Raleigh. In 1968 Congress rejected a proposal to extend the interstate to Wilmington. During this time drivers needed to take, “ a zig-zag route, often along winding country roads”(Steelman 1). The Star News took a poll of politicians around this time as well and concluded that, “most seemed to use some variant of U.S. 421 to U.S. 701 to I-95. Other residents drove up U.S. 117 to Goldsboro to catch U.S. 70 west”(Steelman 1). The completion of Interstate 40 would lead to an hour off of commuters time driving from Raleigh to Wilmington.

View The path to Wilmington in a larger map

The interactive map above presents the route taken upon completion from Raleigh to Wilmington along with the routes Ben Steelman offers travelers had to take before Interstate 40s completion.

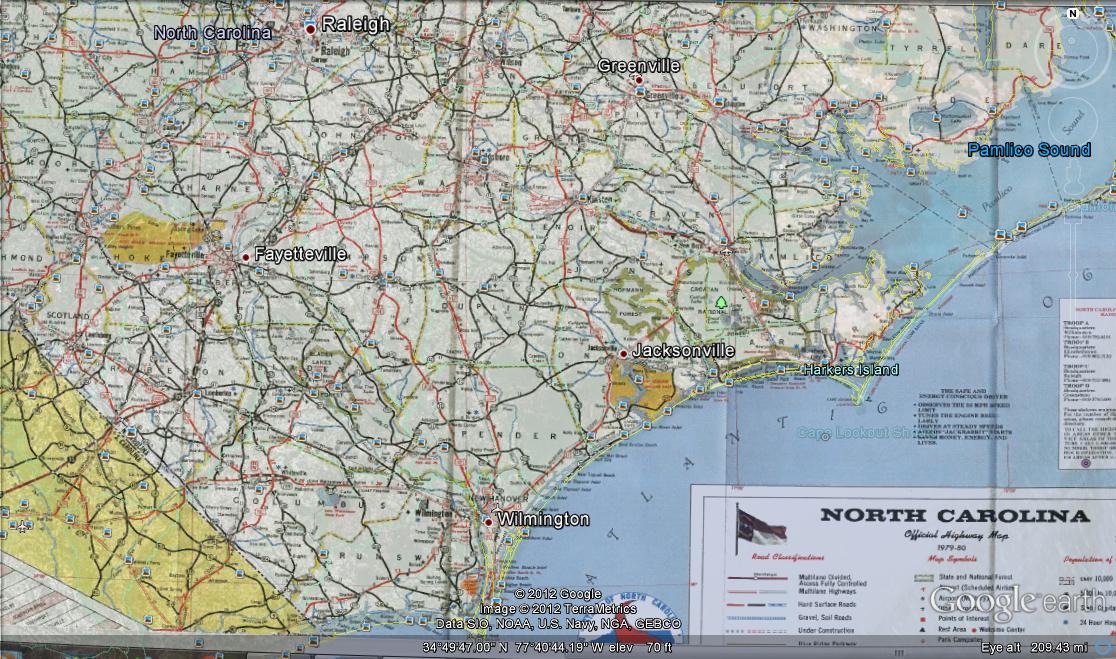
The above map is from the Department of Transportation and shows the completion of Interstate 40 between Wilmington and Raleigh.

Interstate 40’s effect on Employment

The Interstate 40 branch from Raleigh to Wilmington was completed June 29, 1990. With the completion of the interstate Wilmington’s economy soon expanded rapidly. William Hall, an economist at the University of North Carolina Wilmington claims that, “employment grew 5.5% annually in the first five years after I-40 arrived,” and this is compared, “with 2.5 percent in the five years before 1990”(Faulkner 1). This is a huge increase in employment for a city especially within such a small amount of time. The completion of Interstate 40 also allowed for New Hanover county, which Wilmington is a part of to grow 33 percent in between 1990 and 2000. The growth in population did not end there. The city of Wilmington in 1990 had a population of 55,530, in 2010 the population, according to census data, was 106,476. In the twenty years after Interstate 40 opened the population almost doubled.

Wilmington Employment 1999-2007

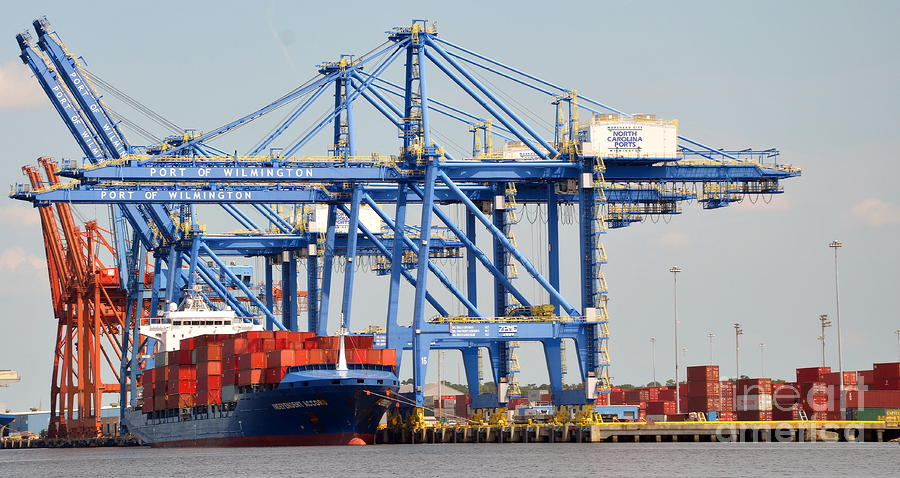
The port of Wilmington. In 2011, cargo exceeded 3.5 million tons through the port.

Transportation of goods

From a business perspective the importance of a major road to transport goods and to attract business is essential. The easy access to the city from Raleigh and Interstate 95 via Interstate 40, made the city attractive to large companies. The industrial sector of Wilmington picked up with the completion of Interstate 40. Star News interviewed some of the cities industrial leaders about the impact of the city and many of them remarked that transportation was a key factor, along with the price of land that they chose to set up in Wilmington. Wilmington is now home to numerous industrial companies. Among them are branches of General Electric, Verizon, International Paper, and Progress energy. Wilmington is also the home of the largest manufacturer of optical fibers in the world; Corning Glass Works. I believe these companies would have looked to establish themselves elsewhere if Interstate 40 would not have made its way to the city, therefore hindering the transportation of goods out of the region. The Port of Wilmington also benefitted greatly from the ability to transport goods inland.

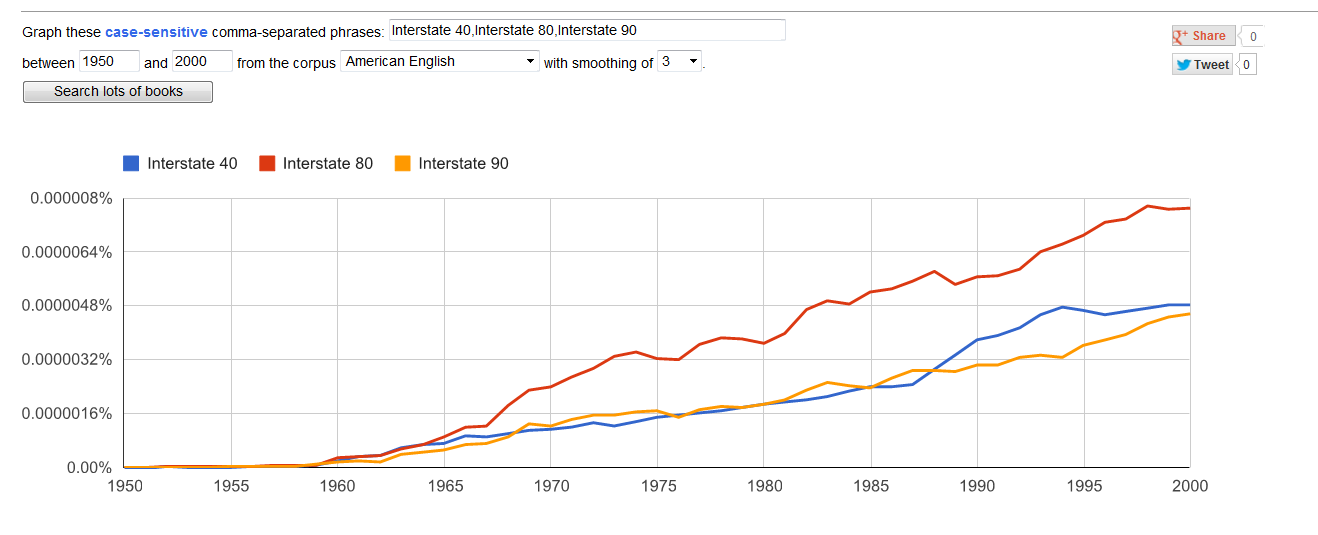
The above chart is a textual analysis from Google. It shows how often the three longest roads in the United States are referenced in comparison to each other. Interstate 40 is still widely referenced and the third longest Interstate in the United States.

Tourism

Tourism has probably been the most influenced by the completion of Interstate 40. Wilmington’s temperate climate, location near three beaches, and historical landmarks, make it an appealing tourist destination. The area benefitted from this immensely, in fact spending in tourism increased 52 percent in the first decade of Interstate 40’s completion. By 2008 the tourism industry had increased by 146 percent according to Kim Hufham, president and CEO of the Wilmington/Cape Fear Coast Convention and Visitors Bureau.  She also adds that, “when I-40 opened it really opened up the corridor for our No. 1 feeder markets for tourism,” and, “before I-40 it was easier to get to Myrtle Beach or Morehead City or Atlantic Beach”(Faulkner 3). The opening of Interstate 40 made Wilmington a two hour drive to the beach for residents of Raleigh. Steelman noted that, “more than one-third of those tourists were from North Carolinians driving from other parts of the state”(Steelman 3).

Tourism Revenue 1991-2011

Growth of the City

It has been shown that the opening of Interstate 40 has been vital for the growth of Wilmington. In 2010 Forbes ranked Wilmington at #32 for Best Places for Business and Careers. (Forbes 1). The 1990’s was a period of rapid growth and development for the city. This couldn’t be possible without the booming tourism industry and the ability to transport goods into and out of the region. Wilmington flourished after the opening of Interstate 40 and was ranked as the second fastest growing city at one point, only behind Las Vegas, Nevada. The completion of Interstate 40 into Wilmington has been the best thing for the region since the World Wars created jobs through shipbuilding.

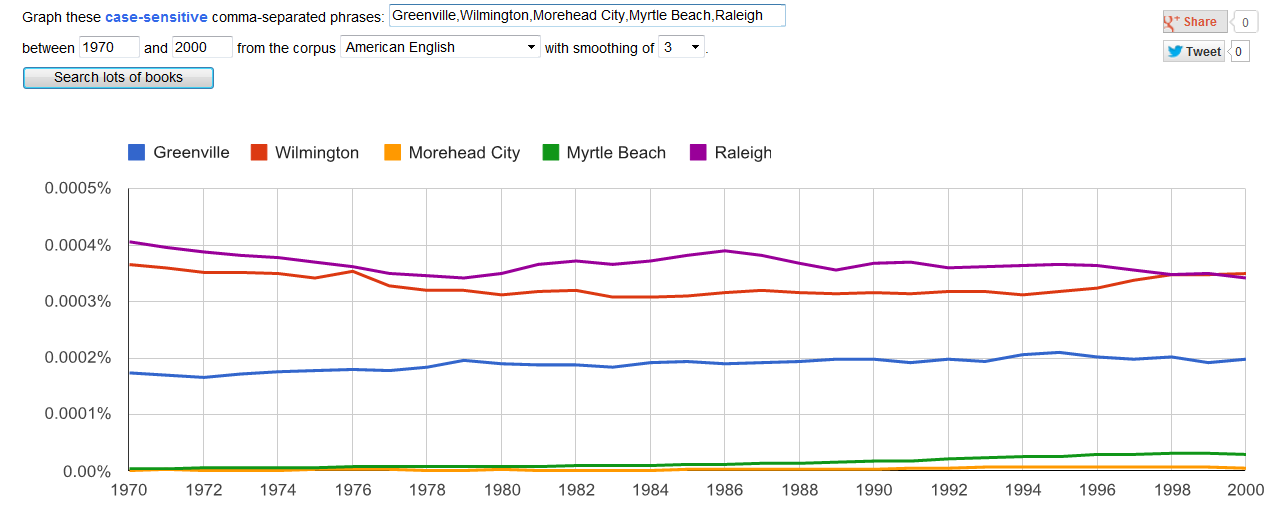
The above chart is a textual analysis of books available to Google. The cities are a sample of large cities in the coastal and piedmont areas of North Carolina along with Myrtle Beach.

Sources

http://forbes.com/lists/2010/1/business-places-10_wilmington-NC_2418.html

http://wilmington.net/wilmington_history.php

http://data.bls.gov/pdq/SurveyOutputServlet

http://www.ncdot.gov/travel/mappubs/statetransportationmap/

http://wilmington.insiderinfo.us/area-overview-of-wilmington-nc/economic-profile/

http://www.starnewsonline.com/article/20100628/ARTICLES/100629691

http://www.starnewsonline.com/article/20100628/ARTICLES/100629689

Preservation of Content

In order to preserve this content I will copy and paste all of this data and send it to various email accounts. I will also save it to a thumb drive in order to keep up with the LOCKSS information we have learned about earlier in the semester. By putting the content of this in multiple places I am aiming to negate any ill effects of loss that may occur. I will also be keeping my content password protected to ensure that I am the only one able to access it. Lastly, I will try to update my password as often as possible and not daisy chain any of my passwords. After all of the work that has gone into this project I would be extremely dissapointed to lose it. Especially if loss occurs before grading.


Scratch and the Maze

The first thing  I would like to point out is that the maze wouldn’t show up when I went to it today. I did get a chance to check out Scratch. Scratch seemed interesting from the video but I was already intimidated by what the possibilities could turn into. I am by no means a tech savvy person so designing or creating something simple seemed to me a dificult task. To help push me away from the idea I am not an artsy person either. What could I possibly want or be able to accomplish by creating a little dancing cat.

I did go through and download Scratch and it was what I anticipated. I would like to think I am not completely unable to understand basic logic but I wasn’t able to do anything past spin the cat in a circle and make it walk a few steps in a square and face different directions. The meowing sound did manage to excite my dogs which is a positive to take from the program. I may go back and try to understand more of the commands but sleep is calling.

Durability of Digital Items

The Rosenzweig article discussed topics about digital preservation. It covered things from the physical side of digital documents and the human element that interferes with the preservation of digital history.

From the physical side we see problems in the rapidly changing formats that documents are saved in. The article claimed that most of the formats that we save information to is no longer valid in ten years. This leaves us with the problem of how to retrieve information once a document is no longer accessible because of formatting problems. A couple solutions to this is to keep a copy of the hardware that is able to read it but that can go bad as well plus you need someone who knows how to repair it if it’s broken. A second way to fix this issue is to emulate the programs. I think this is a good idea personally, it works for video games and those are much more complicated than a textual document. A second issue with physical preservation is the corruption or broken files. Digital data is destroyed more easily than physical copies. This is even more problematic with digital files because in many cases if one bit is corrupted then the whole file is unreadable unlike physical documents where if a word is missing the rest of the document is still available for viewing.

A couple issues for digital preservation on the human side of things are who is responsible for preserving the data and what is worth being preserved. Starting with who should preserve digital documents we want to look at who owns the documents. Now that we have learned that so many things are still licensed online. We find that there is no way for archivists to save data because it can be called copyright infringement. We see this when they talk about libraries. Physical items can be bought by a library and sit in the library and be preserved. Digital texts can not be bought by libraries so the documents sit unguarded on the web. The second topic I want to bring up is what is worth being preserved. It doesn’t make a lot of sense economically for many owners of websites to keep updating and preserving their corner of the internet. A well funded website will continue to run but a site run by Joe Smith with an interest in a random topic will more than likely not survive for long. I don’t know what exactly is worth preserving and I don’t think historians and archivists have a great idea either.

Radio, Television and Computer Ngram

http://books.google.com/ngrams/graph?content=radio%2Ctelevision%2C+computer&year_start=1900&year_end=2000&corpus=15&smoothing=3&share=

The link above is a chart of the use of the words television, radio and computer. I couldn’t figure out how to embed it into this post but the link should work. The relevance of this chart is to show how technology has changed over time. Before television and the computer we can see that the radio was well referenced in books. Once the televions comes out it takes about fifty years for it to catch up to the radio in references. It seems to me that this might be because TV’s were expensive and not everyone could afford them. Computers had a much quicker rise to popularity. It is also the most popular topic out of the three technologies with almost double the number of references in the year 2000. I’m curious to know why compouters were referenced more in 1985 than in 2000 though. Does it have something to do with it moving into the public sphere so the availability of the technology was being hyped up by computer companies?

The problem with Powerpoint

After reading PowerPoint is Evil and reviewing the Abraham Lincoln powerpoint I feel the point of those two readings was to show us how not to make a PowerPoint. The Lincoln slides were awful! It’s a very familiar set of slides that I’ve seen a million times and tend to make me stop paying attention to the speaker. I’m sure I’ve even made slides eerily similar to “Lincoln’s”. The biggest problem I saw with the slides was the fact that there was nothing relevant on the presentation. I would have gotten more just by listening to the speaker. In fact, the presentation would have been more of a distraction to me if it were actually presented. It could have even been worse and forced me to ignore the presentation altogether.

Bubble Chart Critique

B.C. positions approved for foreign workers Many Eyes

This was a chart I found on many eyes that I stumbled across. It was one of the bubble charts that is supposed to show us proportions of jobs compared to each other of unregistered workers in the United States in 2012. There are a lot of negatives to this chart.

The first thing is the lack of any color coding. There are two dots that are colored even though the legend is color coded. Maybe they weren’t done with the chart when they posted it to manyeyes. I am not a fan of the lack of labeling on all of the dots as well. I understand that it may be difficult to put text into the dots but if they were color coded according to the chart it may alleviate the confusion that I got from it. Those are probably my biggest gripes for this particular chart and I hope that they fix them before using this chart in any way.

Response to Feltron Reports

I read the 2009 and 2010 Feltron reports for this week. I felt the information was poorly presented and confusing. I liked the idea of gathering data on daily activities from the 2009 report but the charts and text in the reports were poorly done. There was a lot of information presented as well and I feel like he might have been better served omitting some data so that the information was easier to follow.

The 2010 report was much worse than the 2009 report as well. I liked the idea in 2009 to track daily activities and was able to see what kind of person this man was (an alcoholic) and was hoping for more of the same. By keeping the same format for the two reports we would have been able to track change in activity over time but when he decided to completely change the information and presentation overall it led to another confusing and wasted presentation. The 2010 report was focused on his life and the events that he was a part of. This included where he travelled throughout his life. The line map was interesting but the information was not something I was looking for after reading the 2009 report. The most interesting part to me was the index. He listed museums he had visited and movies he had seen aloing with other random facts about himself. I’m sure that was not intended by the presenter but the rest of the report was poorly organized in my opinion.

Maps on Google Earth

For our practice we were asked to take a historical map and place it over the Google Earth maps. It was pretty easy. After finding a map, which was the hardest part, I simply saved it and opened Google Earth. After that I placed the map down and looked at the border of Mexico to begin aligning my maps. Shortly after adjusting so that the border’s lined up on both maps I had to zoom out. I needed to do this to stretch the map out because San Diego county is actually pretty big. After stretching it out to fit, I lined it up with the ocean and the border of Arizona. San Diego county doesn’t stretch out to Arizona now so I learned that it actually used to which is interesting on its own. The last thing I used to align the maps was the river and that’s how I got the maps to match!